This is the source code. Now you must point your terminal to the top directory of this folder
cd /path/to/folder.lv2
then run
make
to build the binaries. You’ll find then a new generated folder.lv2 in the folder.lv2. This contain the lv2 bundle with the .ttl files and the .so libraries…
after make run make install
that will install the bundle into your home .lv2 directory. When done, your lv2 host like ardour should be able to find and load it.
2 Likes
Thank you for your patience!
I still have a few questions
I am trying to model the janray pedal code using this tool, and it just so happens that you have done the same project before. I currently run some other circuit diagrams and they can generate code, but this one doesn’t.
`(guitarix) root@68e2d113fe5c:/mnt/data/trunk/tools/ampsim/DK/gschem-schematics# dkbuilder && ./build-plug.py -i janray.sch -F --table 1 -n Janray

Input file 1: janray.sch
module_id: janray
Invalid refdes ('vcc1') and pin ('unknown') passed to get-nets
Invalid refdes ('vcc1') and pin ('unknown') passed to get-nets
['R34', 'RESISTOR', '7.5k', 'unnamed_net9', 'GND']
['R33', 'RESISTOR', '9.2k', '+9V', 'unnamed_net9']
['OUT1', 'OUTPUT', 'None', 'unnamed_net17']
['U2', 'OPAMP', 'Vcc=9,Vee=0,A=1e5', 'unnamed_net13', 'unnamed_net15', '+9V', 'GND', 'unnamed_net14']
['R23', 'VARIABLE_RESISTOR', 'value=10k;var=vol', 'unnamed_net16', 'GND', 'unnamed_net17']
Traceback (most recent call last):
 File "./build-plug.py", line 680, in <module>
   main(sys.argv[1:])
 File "./build-plug.py", line 677, in main
   dk.build()
 File "./build-plug.py", line 529, in build
   c1.read_gschem(workfile)
 File "./analog.py", line 517, in read_gschem
   exec mk_netlist.read_netlist(filename) in v
 File "./mk_netlist.py", line 247, in read_netlist
   val = mk_dict(val,value=Resistance,a=Number,inv=Number,var=Text,name=Text)
 File "./mk_netlist.py", line 88, in mk_dict
   for k, v in [v.split("=") for v in val.split(",")]:
ValueError: too many values to unpack
(guitarix) root@68e2d113fe5c:/mnt/data/trunk/tools/ampsim/DK/gschem-schematics#
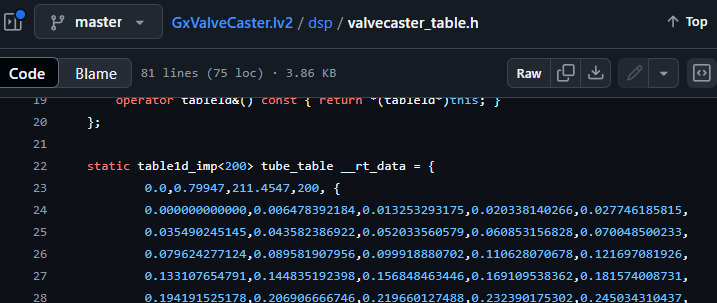
I also used the valvecaster.sch file you sent me and generated the code, but I found that it is different from the nonlinear table curve you posted on github. Is there something I did wrong?
I looked at the txt (dsp) file you posted in the comment section, and it is the same as the dsp file I generated using the tool, but the only difference is the linear table.
static tablevalvecaster_imp<200> valvecaster_table __rt_data = {
	0,0.833333,142.143,200, {
	0.000000000000,0.004776263063,0.009710653622,0.014808424886,0.020074844872,
	0.025515160421,0.031134554785,0.036938098231,0.042930691097,0.049116998799,
	0.055501378391,0.062087796445,0.068879738242,0.075880108505,0.083091124304,
	0.090514201128,0.098149833635,0.105997473118,0.114055404332,0.122320624893,
	0.130788731098,0.139453814502,0.148308374020,0.157343248583,0.166547575366,
In addition, I also tried to model mxr dist and boss ds1, and I found that the generated faust dsp file is very different from the one you posted on GitHub. Are the faust files of ds1/mxr dist on GitHub generated by the tool and then modified manually?Or is it that with the iteration of versions, the tools for generating code have changed a lot, so the generated code will be very different? ![]()
1 Like
This looks as if you use 2 “vcc1” modules. Any module used in a circuit must have a unique identifier, so rename one of them to “vcc2” should do it.
Yep, mxr and ds1 was handcrafted by circuit analysis.
For the valve caster table, well, it may be that I’ve changed some parameters to generate this table, I can’t remember. ![]()
I have modified the circuit to use only one vcc1, but it still doesn’t work, and I still get the same error message. This is my sch file janray_p1.sch - Google Drive
Or can you share your timray sch file and dsp file with me? I am still struggling with whether to split the circuit into multiple parts. For the dsp code I generated with the tool, I found that there is always a large filter structure.
I’ve send you a mail with the schematic files I used.
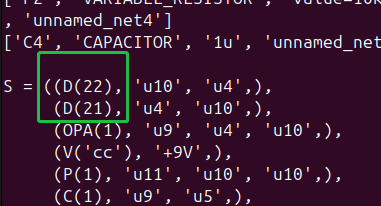
As far I remember dkbuilder always has trouble with two diodes in series. When I remember right I’ve implemented therefore a “D2” module which calculate the behave of two diodes in series while only one is used in the netlist.
1 Like
I see, thanks. How do I enable this D2 module? Do I need to enter any options during the code generation phase? Or can I directly replace the function content of the module in model.py (overwrite the content of the D2 module to the D module)?
It should work by just set the refdes to D2N, means D21 D22 etc.
I found that the format written as D2N cannot be recognized. I verified that the generated result is the same as DN. And during the code generation stage, it seems that the tool will recognize it as D(24)
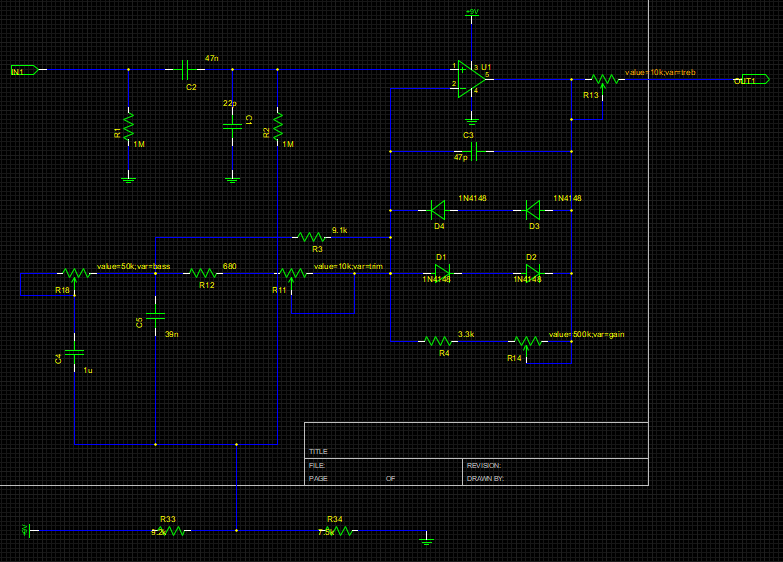
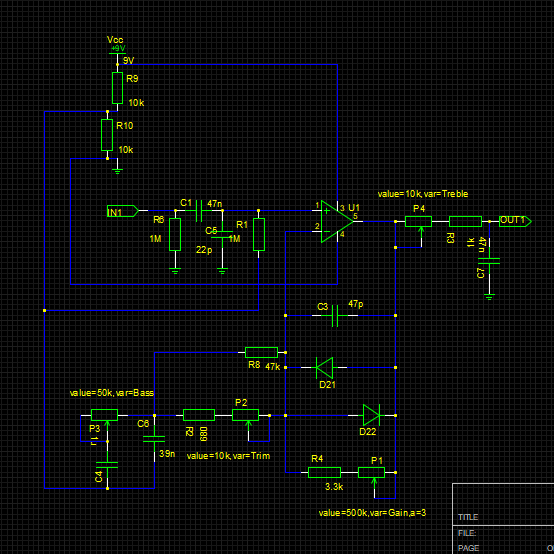
I directly generated the code from the tinray.sch file you sent me, and it basically matches the version you posted. But I changed the circuit diagram, not using ± voltage, and replaced it with a regular pedal 9V single power supply, and the generated clipping curve is completely different. I don’t know where I went wrong, but in practice, the clipping curve of single power supply should not be much different from that of dual power supply.
The maximum values of these two tables are 0.222 and 0.833, which are very different.
//power = 9v - GND
// janray_table generated by DK/circ_table_gen.py -- do not modify manually

 // variables used
 // --sig_max  1.400000
 // --table_div  7.363166
 // --table_op  1.000000

struct tablejanray { // 1-dimensional function table
    float low;
    float high;
    float istep;
    int size;
    float data[];
};

template <int tab_size>
struct tablejanray_imp {
    float low;
    float high;
    float istep;
    int size;
    float data[tab_size];
    operator tablejanray&() const { return *(tablejanray*)this; }
};

 static tablejanray_imp<200> janray_table __rt_data = {
	0,0.22219,142.143,200, {
	0.000000000000,0.000146484089,0.000739862981,0.001856769967,0.003263894174,
	0.004762992710,0.006306888211,0.007880587234,0.009471698649,0.011073445894,
	0.012680123039,0.014288054294,0.015894099704,0.017496081944,0.019092128247,
	0.020680895610,0.022261228734,0.023832292444,0.025393373541,0.026943964809,
//power = ±9v
// janray_table generated by DK/circ_table_gen.py -- do not modify manually

 // variables used
 // --sig_max  1.400000
 // --table_div  1.925526
 // --table_op  1.000000

struct tablejanray { // 1-dimensional function table
    float low;
    float high;
    float istep;
    int size;
    float data[];
};

template <int tab_size>
struct tablejanray_imp {
    float low;
    float high;
    float istep;
    int size;
    float data[tab_size];
    operator tablejanray&() const { return *(tablejanray*)this; }
};

 static tablejanray_imp<200> janray_table __rt_data = {
	0,0.833333,142.143,200, {
	0.000000000000,0.000555106056,0.002757145131,0.006761341715,0.011674798421,
	0.016895363471,0.022297870088,0.027821418922,0.033425189861,0.039082367776,
	0.044772840516,0.050481957174,0.056198160148,0.061912600408,0.067618114929,
Then I noticed that these lines of comments are different, what do they mean?
// variables used
// --sig_max 1.400000
// --table_div 1.925526
// --table_op 1.000000
In circuit simulation, does this tool agree that a floating point number of 1 is equal to 1V? Can I specify the voltage range to scan? Can I also specify the range of the table to be obtained? I see that most of the maximum values of the tables you posted on GitHub are around 0.8. Does it mean that the output is 0.8V?
Then I just found that the generated clipping curve is not the same as the one published on github. At the end, it goes directly from 0.829687361315 to 0.833333333333. But the last three digits of the table published on github are 0.832973145664, 0.833156565700, 0.833333333333
static tablejanray_imp<200> janray_table __rt_data = {
	0,0.833333,142.143,200, {
	0.000000000000,0.000555106056,0.002757145131,0.006761341715,0.011674798421,
	0.016895363471,0.022297870088,0.027821418922,0.033425189861,0.039082367776,
	0.044772840516,0.050481957174,0.056198160148,0.061912600408,0.067618114929,
	0.073309079066,0.078980884813,0.084629876474,0.090253053416,0.095848039834,
	0.101412901602,0.106946131548,0.112446529823,0.117913196803,0.123345451350,
	0.128742827674,0.134105017476,0.139431868942,0.144723344607,0.149979521532,
	0.155200559889,0.160386703810,0.165538257498,0.170655586446,0.175739098987,
	0.180789247706,0.185806514983,0.190791414507,0.195744479819,0.200666265846,
	0.205557339745,0.210418282421,0.215249681138,0.220052131011,0.224826228993,
	0.229572575325,0.234291768619,0.238984407248,0.243651085305,0.248292393935,
	0.252908917994,0.257501237323,0.262069923977,0.266615543432,0.271138652286,
	0.275639799402,0.280119523991,0.284578356696,0.289016817990,0.293435419201,
	0.297834661173,0.302215035236,0.306577022082,0.310921092682,0.315247707344,
	0.319557316581,0.323850360318,0.328127268711,0.332388461486,0.336634348707,
	0.340865330224,0.345081796397,0.349284127637,0.353472695083,0.357647860224,
	0.361809975534,0.365959384160,0.370096420521,0.374221410045,0.378334669740,
	0.382436507971,0.386527225002,0.390607112809,0.394676455591,0.398735529621,
	0.402784603720,0.406823939139,0.410853790005,0.414874403227,0.418886018918,
	0.422888870314,0.426883184176,0.430869180728,0.434847074029,0.438817071931,
	0.442779376426,0.446734183614,0.450681684034,0.454622062639,0.458555499107,
	0.462482167824,0.466402238180,0.470315874555,0.474223236596,0.478124479215,
	0.482019752845,0.485909203444,0.489792972733,0.493671198206,0.497544013358,
	0.501411547687,0.505273926918,0.509131273005,0.512983704336,0.516831335747,
	0.520674278709,0.524512641342,0.528346528594,0.532176042255,0.536001281124,
	0.539822341027,0.543639314969,0.547452293157,0.551261363140,0.555066609831,
	0.558868115644,0.562665960508,0.566460222002,0.570250975364,0.574038293623,
	0.577822247606,0.581602906059,0.585380335656,0.589154601117,0.592925765213,
	0.596693888875,0.600459031202,0.604221249564,0.607980599609,0.611737135357,
	0.615490909213,0.619241972049,0.622990373218,0.626736160637,0.630479380791,
	0.634220078818,0.637958298510,0.641694082391,0.645427471723,0.649158506578,
	0.652887225839,0.656613667270,0.660337867524,0.664059862197,0.667779685845,
	0.671497372029,0.675212953332,0.678926461407,0.682637926985,0.686347379922,
	0.690054849210,0.693760363021,0.697463948714,0.701165632875,0.704865441329,
	0.708563399176,0.712259530798,0.715953859900,0.719646409511,0.723337202020,
	0.727026259187,0.730713602169,0.734399251529,0.738083227267,0.741765548826,
	0.745446235117,0.749125304527,0.752802774946,0.756478663772,0.760152987935,
	0.763825763899,0.767497007694,0.771166734911,0.774834960730,0.778501699920,
	0.782166966864,0.785830775560,0.789493139642,0.793154072380,0.796813586704,
	0.800471695203,0.804128410144,0.807783743474,0.811437706838,0.815090311578,
	0.818741568754,0.822391489141,0.826040083248,0.829687361315,0.833333333333
	}
Maybe you must change the working range of the opamp to match that? Or push the sig_max value.
The table was generated by sending a signal with sig_max value to the circuit simulation. Then we could compare the input with the output and generate the table from it.
When no value for sig_max is given on command line, it’s default to 1.4.
The values in the table been used in the digital domain, means we must convert them to the range -1.0 <-> +1.0 with table_div. When no value for it is given on command line, circ_table.py will calculated it.
table_op is the step operator for used to calculate the response value from the table. If you know what you do you could set all this values during table generation, otherwise circ_table.py will calculate them.
No. As pointed out above, this table is already in the digital domain.
I’ve used different values for the table generation, They are stored in the generated table as comment on top.
I found that the format written as D2N cannot be recognized. I verified that the generated result is the same as DN. And during the code generation stage, it seems that the tool will recognize it as D(24)
Can I just replace the two model functions in model.py? In this way, when two diodes are connected in series, I only need to temporarily change the class name.
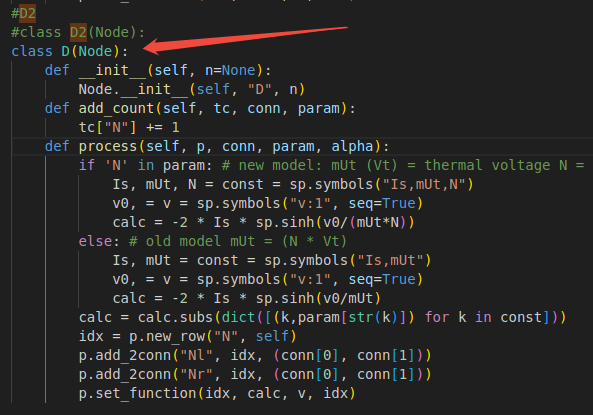
Yes, why not. You may as well try to rename it to something like “Di” or “DD” to get a unique class name without using a number in the class name.
As I said, it was some time when I worked on this and maybe I’ve leave it in a bad state, I can’t really remember. I’ve used the D2 class just temporarily as well.
Thank you for your patience. But I still don’t understand why the condition for generating this overdrive effect code is that the signal voltage must be 20v here
(I tried other voltage values between 0-2 and failed, producing a curve that was only slightly curved but not clipping.)?
Because the supply voltage of the timray.sch file you sent me is only ±9v, or does the 20 here not refer to the voltage? And the conduction voltage of this diode is less than 1v. From the point plot, it is found that clipping only starts at the last 1/3, that is, the voltage is very high before clipping begins. If 20 represents the voltage, maybe this is a bit unreasonable?
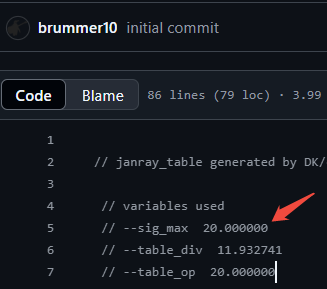
Yes, it isn’t voltage, It is just a digital signal send to the circuit. Normal range would be 0 <-> 1.4. Some circuit response better with higher signal values, that may be due some incorrect calculations in the toolkit, or, maybe by the fact that we could only calculate for ideal models. As you know, every condenser, for example, have it’s own very specific response, so, every opamp, and so on. We can’t reflect that all in the toolkit as the CPU isn’t able to do the calculations. That is one of the reasons why modern toolkits doing this stuff using the GPU instead.
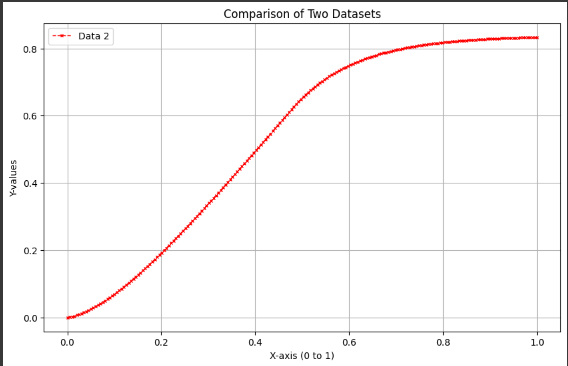
When you now have a look at the plot, you’ll see that there is a amplification factor. A input from 0.2 (x-axis) will stay at 0.2 (y-axis), a input of 0.4 will amplify to 0.5 and than at a input of 0.5 clipping starts
keep in mind we talk now about digital signal in the range of -1.0 <-> +1.0 so, clipping starts as half, moves from soft clipping into hard clipping. That cover the analysis from here:
But true is, dkbuilder is far from perfect. all results needs to b taken with a grain of salt.
2 Likes